The Water Line: Flood Risk and Industrial Resilience in Assam
Death toll in Assam's severe 2026 floods has risen to 100 people, while 1.5 lakhs are affected across 10 districts. With marquee investments like the Rs 27,000 crore Tata semiconductor plant, all stakeholders need to work towards building flood-resilient industrial infrastructure for Assam to industrialise.

0 of 10 sections read
On 19 July 2026, floodwaters entered the ONGC workover site at Nazira in Sivasagar district. Workers from Kriss Drilling Pvt Ltd, engaged in oilfield operations, found themselves stranded as approach roads went under. It was the first confirmed instance this season of a flood event shutting down industrial operations at a named facility.
By 9 Aug, 100 people were dead. APDCL had disconnected 619 distribution transformers, leaving 27,303 consumers without power. Union Minister Sarbananda Sonowal described the situation as “very serious.”
This briefing asks one question: where does Assam’s industrial base stand relative to the flood plain, and what should facility owners, lenders, and policymakers do about it?
The headline finding: ISRO’s National Remote Sensing Centre has mapped Assam’s floods from space for 26 years. Their Flood Hazard Zonation Atlas, built from 389 satellite datasets spanning 1998 to 2023, classifies Morigaon district at 70 to 80% cumulative flood inundation, the highest of any district in the state.
Morigaon is where the Rs 27,000 crore Tata Semiconductor Assembly and Test facility is under construction at Jagiroad. The Asian Development Bank independently names Morigaon as one of only four top-priority zones for flood and erosion intervention on the entire Brahmaputra.
What this briefing covers:
- The three-wave chronology of the 2026 season and what it disrupted (Section 2)
- What ISRO’s 26-year satellite record reveals about which districts carry the highest exposure (Section 3)
- Why areas that never flooded before are now flooding, and what that means for design assumptions (Section 4)
- Sector-by-sector exposure: semiconductors, oil and gas, tea, and MSMEs (Section 5)
- Climate projections that show the Brahmaputra basin’s flood risk is increasing, not stable (Section 6)
- The power grid’s role as the transmission mechanism between a hydrological event and an industrial shutdown (Section 7)
- The engineering toolkit: dry floodproofing, wet floodproofing, elevation, drainage, and early warning (Section 8)
- What the state, multilateral lenders, and the ADB are already building in the relevant districts (Section 9)
- A phased roadmap, starting with a step that costs nothing and takes an hour (Section 10)
Who should read this: any industrial promoter, plant manager, lender, or policymaker with exposure to Assam’s manufacturing, energy, or agro-processing base. The Nazira shutdown showed the risk is operational, not hypothetical. The question is what comes next.
The 2026 monsoon did not follow the textbook Brahmaputra pattern. It arrived in three waves, each from a different direction, and the sequence matters because it determines which flood-proofing measures would have helped and which would not.
Wave one: late June. Dhemaji, Dibrugarh, Lakhimpur, Chirang, Nalbari. Over 45,500 people affected, 96 villages submerged. The Simen river destroyed the piers of a railway bridge between Archipathar and Simen Chapari stations, cutting rail traffic on that line indefinitely. Standard early-monsoon geography, standard tributary flooding.
Wave two: mid-July. Guwahati’s Hatigaon area went underwater from urban waterlogging. Then, from 19 July, flash floods hit the Nazira region of Sivasagar, the heart of Assam’s onshore oil industry, stranding ONGC workover crews as access roads went under.
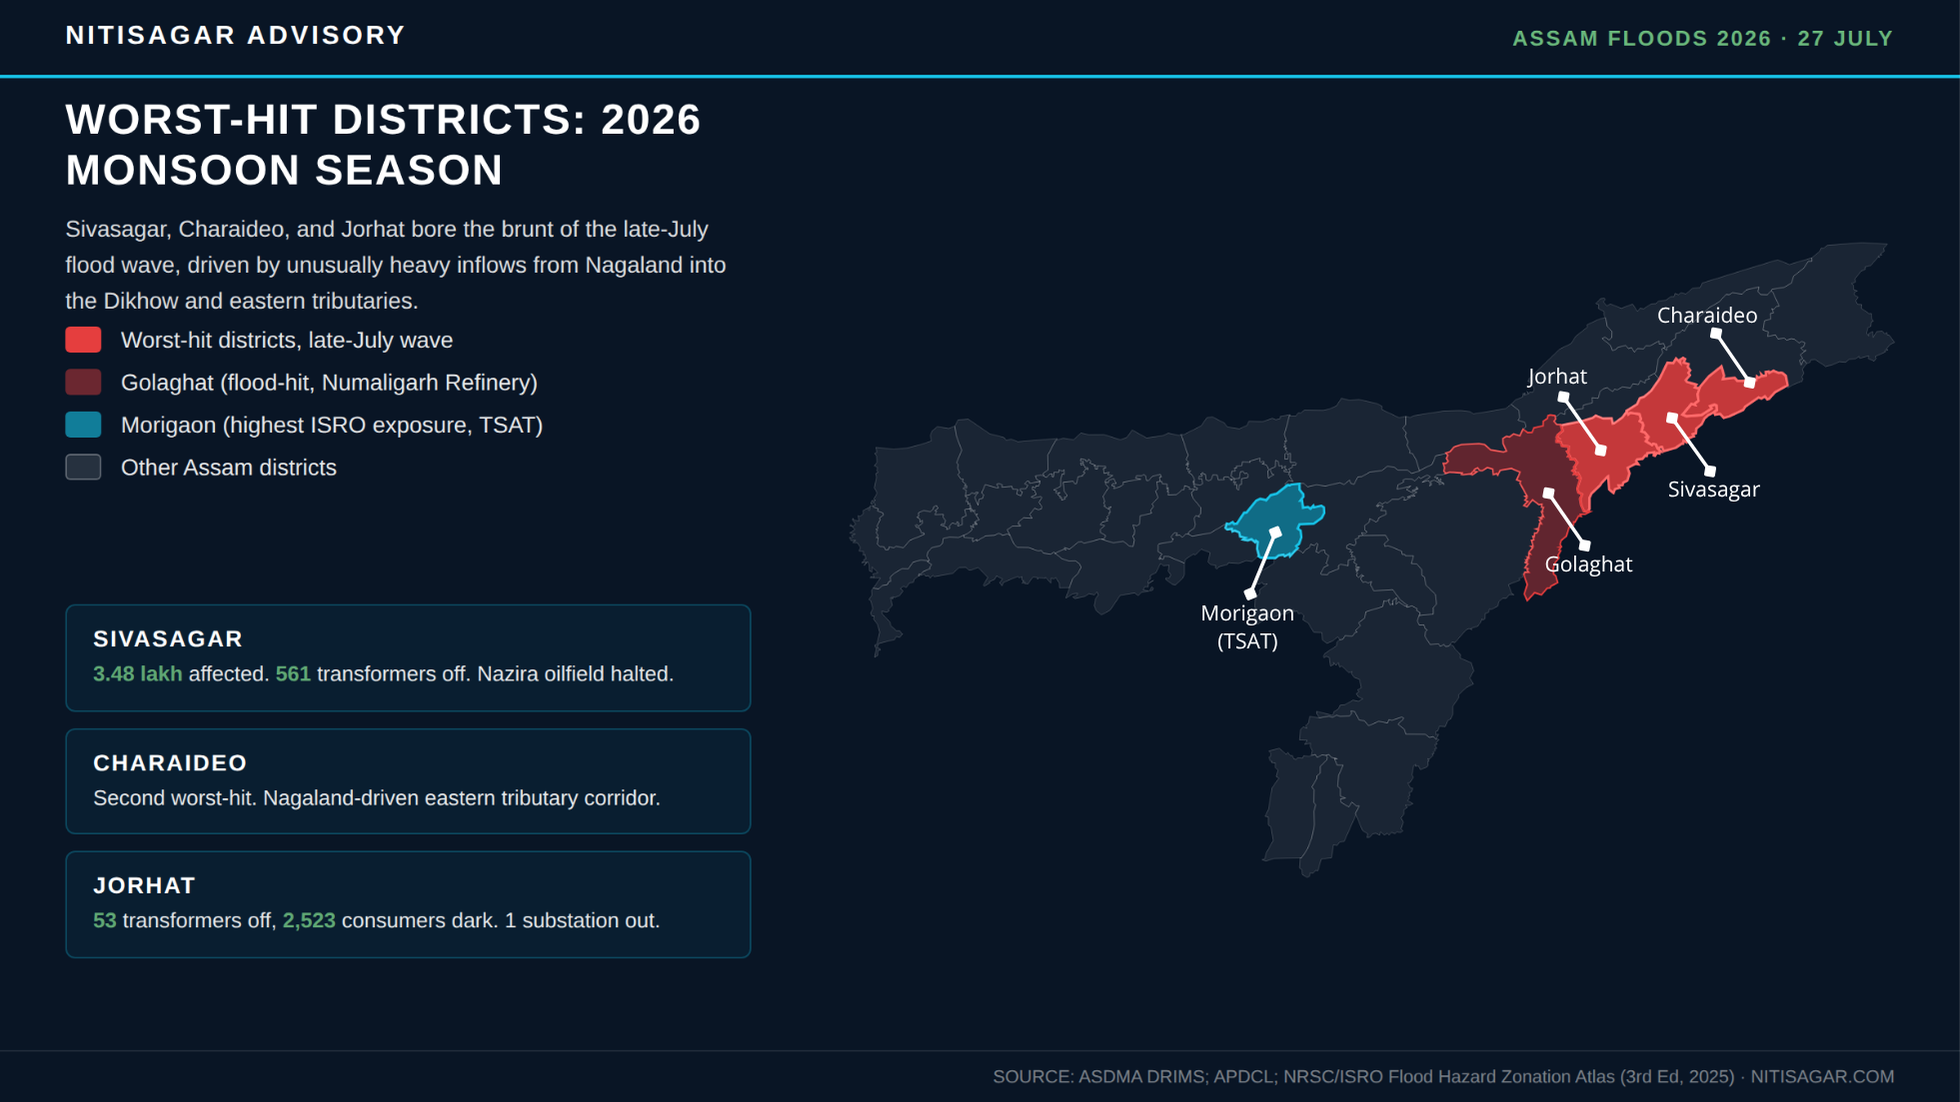
Wave three: late July. The worst. The Dikhow river at Sivasagar town went above what ASDMA terms “severe flood condition,” and CM Himanta Biswa Sarma attributed this wave to unusually heavy inflows from Nagaland, a catchment that does not normally drive Assam’s flood hydrology.
The escalation was rapid:
- 23 July: 41 dead, 7.27 lakh people affected across 25 districts
- 26 July: 62 dead, Sivasagar worst-hit at 3.48 lakh people
- 27 July: 68 dead, 5.24 lakh still affected across five districts
- 9 Aug: 100 dead, 1.37 lakh still affected across seven districts
The cost. The Assam Water Resources Department records an average annual flood loss of Rs 200 crore. Bad years blow well past that number:
- 1998: Rs 500 crore
- 2004: Rs 771 crore
- 2020: state sought Rs 2,642 crore from the Centre for repair alone
- 2026 (so far): Rs 111 crore released for essentials; minister-led rehabilitation teams being deployed
Those numbers tell the human and fiscal story. But they do not answer the industrial question: is there a way to know, before a flood arrives, which districts carry the highest exposure? Twenty-six years of satellite data say yes.
Assam was the first Indian state to receive a satellite-based flood hazard atlas. The NRSC prepared the first edition in 2011 and has updated it three times since. The current third edition, released in 2025, covers all 35 districts and 173 revenue circles.
The method is well-validated remote sensing: satellite imagery captured during flood-season overpasses is compared against dry-season baselines. Water absorbs near-infrared and microwave radiation, so flooded ground appears unambiguously even under monsoon cloud cover.
Each image is classified, and inundation frequency is aggregated across the full 26-year record. The output is a five-class hazard rating at the revenue-circle level.
The state-level picture:
- Total flood-affected area across the 26-year record: 27.08 lakh hectares, of which 18.22 lakh hectares is cropland
- Very high hazard: 3.26 lakh hectares
- High hazard: 2.86 lakh hectares
- Annual inundation ranged from 2.11 lakh hectares (2009, the mildest year) to 12.85 lakh hectares (a peak reached in 2002, 2017, 2020, and 2022)
The district-level picture is more useful for industrial planning:
- 70-80% cumulative inundation (highest bracket): Morigaon and Bajali
- 50-70%: Sivasagar, Nagaon, South Salmara, Lakhimpur, Nalbari, Dhemaji, Barpeta, Hojai
- 30-50%: 19 districts (state-wide distribution)
- Below 30%: 7 districts
Morigaon and Bajali recorded the highest cumulative flood inundation of any districts in Assam over the 26-year satellite record. The Rs 27,000 crore Tata Semiconductor Assembly and Test facility is under construction at Jagiroad, in Morigaon, on a 171-acre site roughly 55 km from Guwahati.
The Jagiroad site did not flood in 2026, as far as available reporting shows. That is beside the point: a district can miss one flood season and still carry the state’s highest long-run flood exposure.
The atlas data is available free on ISRO’s Bhuvan geoportal and the National Database for Emergency Management. Any MSME can check a prospective site’s hazard classification before committing capital.
We are working to incorporate flood hazard data into Nitisagar’s Vendor Readiness Assessment product, so that facility-level flood exposure becomes a standard input alongside subsidy eligibility and compliance status.
The satellite record captures what has already happened. But Assam’s flood geography is not staying where it was.
Aaranyak, a Guwahati-based environmental research organisation, documented in 2024 that districts like Dima Hasao and Karbi Anglong had begun experiencing flooding for the first time. These are hill districts with no meaningful flood history.
Majuli, the world’s largest river island, saw sudden flash flooding from the combined behaviour of the Brahmaputra and the Subansiri. The predictability that once let residents anticipate flood timing, Aaranyak’s researchers observed, has gone.
The 2026 season reinforced the pattern. The worst wave came not from the Brahmaputra’s classic tributaries but from inflows originating in Nagaland. A hazard model built purely on historical Brahmaputra gauge data would have missed the catchment that drove this year’s crisis.
Engineers call the assumption that past flood statistics predict future risk “stationarity.” The climate literature says stationarity is broken for the Brahmaputra:
- A CMIP5 study across 18 major Indian river basins found the Brahmaputra carries the highest projected increase in extreme one-day flood events of any basin studied: 22 additional events by mid-century, 33 by end-century, under high emissions
- A World Bank technical note projects a 13% increase in annual Brahmaputra discharge and a 40% rise in sediment load by end-century
- CMIP6 ensemble projections show mean annual precipitation increasing by 7.5% (low emissions) to 19.4% (high emissions) by 2071-2100 versus the 1981-2010 baseline
The Assam Water Resources Department records that the Brahmaputra has widened by up to 15 km at some locations, with average annual land loss of roughly 8,000 hectares to bank erosion. A site assessed as safely set back from the river a decade ago may no longer be set back from it today.
A facility designed to yesterday’s 100-year flood elevation is not designed to tomorrow’s. The gap between the two will widen over the operating life of any asset commissioned in the 2020s. For Jagiroad, with a decades-long production horizon, the design flood level should include explicit climate-adjustment freeboard on top of the standard return-period calculation.
Gear Shift #1 tracked the infrastructure build-out around Jagiroad as a signal of Assam’s emerging semiconductor ecosystem. That build-out is located in exactly this kind of shifting hazard zone. The satellite data identifies the exposure. The climate projections confirm it is getting worse. The next question is which specific industries and facilities are affected.
1. Electronics and semiconductors: Jagiroad, Morigaon district.
The Tata Semiconductor Assembly and Test (TSAT) facility occupies 171 acres on the former Nagaon Paper Mill site. Key numbers:
- Investment: Rs 27,000 crore, with Rs 14,044 crore in combined central and state incentive support
- Designed capacity: 48 million chips per day
- Anchor customer: Qualcomm, for automotive semiconductor modules
- Commercial production expected within the current financial year
Semiconductor assembly requires cleanroom environments with tight humidity and particulate control. Any water ingress risks corrosion, cleanroom contamination, and extended requalification downtime that costs far more than the physical repair itself.
As Gear Shift #5 tracked, this facility is entering its commissioning phase. That makes right now the cheapest moment to engineer flood resilience in.
2. Oil and gas: Nazira, Numaligarh, Duliajan.
Assam hosts four major refineries: Digboi (0.65 MMTPA), Guwahati (3.0 MMTPA), Bongaigaon (2.35 MMTPA), and Numaligarh (3.0 MMTPA, Navratna PSU under Oil India since December 2025). Oil India’s field HQ at Duliajan anchors 1,250+ producing wells.
Nazira’s ONGC workover operations were halted on 19 July when floodwaters entered operational buildings and cut all access roads. Numaligarh is located on the Dhansiri, which ran above danger level during the same event.
3. Tea: Dighaltarang, Tinsukia district.
Aggressive flow through the Dangari channel has eroded 35.48 hectares of plantation land at the Dighaltarang Tea Estate. The factory, hospital, and worker quarters now stand roughly 300 metres from the advancing erosion line.
A Rs 4 crore embankment has proved inadequate, and 1,474 families depend on this estate. As our agri-food intelligence brief noted, Assam produces half of India’s tea. Erosion threatens the production base itself, not just one season’s crop.
4. MSMEs: Guwahati and the Brahmaputra corridor.
Assam’s precision engineering, fabrication, and food processing units cluster around Guwahati and secondary towns along the Brahmaputra. Guwahati experienced direct waterlogging in July 2026. The 14 approvals required to set up a factory in Assam do not currently include a flood hazard screening step. They should.
The Nazira shutdown proved the risk is operational. But a flood does not need to enter a factory to stop production. It only needs to cut the power grid.
Peak outage, 22 July 2026. 82,000 consumers lost power. 1,730 distribution transformers and 11 kV feeders were disconnected. Sivasagar alone: 62,000+ consumers out of roughly 111,040. Three 33/11 kV substations and 22 feeders disconnected in one district.
Recovery snapshot, 27 July 2026 (from the APDCL circle-wise outage table released by the CMO):
- Sivasagar: 561 DTRs still disconnected, 24,531 consumers dark, 8 feeders off, 2 faulty 33 kV lines
- Jorhat: 53 DTRs, 2,523 consumers, 1 faulty 33 kV line, 1 substation out
- Golaghat: 3 DTRs, 150 consumers
- Bongaigaon, North Lakhimpur: 1 DTR each, under 100 consumers combined
- Total across all circles: 619 DTRs, 8 feeders, 27,303 consumers
An MSME in Sivasagar running a CNC machine, a food processing line, or a packaging operation lost five or more days of grid power. At that point, the production loss is total, not proportional.
The APDCL transformer deposit of Rs 5 to 15 lakh, which our factory setup guide flags as a major unplanned cost, buys a connection. It does not buy flood-resilient power delivery. Resilience requires backup generation sized for multi-day outages, with fuel reserves and maintenance plans that account for roads being cut.
A factory can survive a flood that stays outside its perimeter wall. It cannot survive five days without electricity when its diesel runs out on day two. The engineering response to this starts with the building itself.
International flood-resistant design practice, codified in ASCE 24 and FEMA’s NFIP Technical Bulletins, distinguishes two structural strategies. The choice depends on site-specific flood depth and velocity, not on preference or budget.
Dry floodproofing seals the structure watertight below the design flood elevation. Walls, openings, and utilities are engineered to resist hydrostatic and hydrodynamic loads. FEMA is explicit about limits:
- Not suitable where flood depth exceeds 0.9 m (3 feet)
- Not suitable where velocity exceeds 1.5 m/s (5 feet per second)
- Not suitable where wave heights run 0.45 to 0.9 m
Given the flash-flood velocities at Nazira, dry floodproofing applies only to lower-velocity, lower-depth sites.
Wet floodproofing accepts that water enters and designs for it. Engineered openings or breakaway panels allow floodwater to pass through at grade level, equalising pressure and reducing structural loads. Well suited to ground-floor areas used for parking, storage, or access. All equipment in the wet zone must be relocated above the design flood elevation.
Elevation remains the most durable measure. Raise the finished floor of production and critical-equipment areas above the design flood elevation, plus freeboard. Standard practice: at least 0.3 m above base flood elevation for full floodproofing credit.
For semiconductor and cleanroom operations specifically (Jagiroad):
- Elevate electrical switchgear, control rooms, air-handling units, chemical distribution systems, and ultrapure water plant above the design flood elevation
- Route all cable entries through sealed watertight glands
- Locate backup generators and fuel storage above the design flood elevation
- A single point of water ingress into any cleanroom-supporting system forces full requalification
For every industrial facility:
- Perimeter bunding sized to the site-specific design flood elevation, with sealed penetrations at every access point
- Sump pits and pumping capacity with dedicated backup power
- Subscribe to CWC flood bulletins and ASDMA DRIMS alerts for the relevant river reach
- Define trigger-based SOPs tied to specific gauge readings: a pre-agreed water level at which operations pause, systems move to backup, and site access restricts
- Annual business-continuity plan test before monsoon season
None of this works in isolation. The state and multilateral lenders are already investing in structural flood protection in the districts this briefing flags. The question is whether industrial planning connects with those investments, or runs in parallel.
Two multilateral programmes operate in exactly the districts identified above.
The ADB programme. The Climate Resilient Brahmaputra Integrated Flood and Riverbank Erosion Risk Management Project names four highest-priority intervention areas:
- Dibrugarh (Oil India HQ, Duliajan; flood-hit in June and July 2026)
- Palasbari-Gumi stretch near Guwahati (the MSME corridor)
- Morigaon (the Jagiroad TSAT semiconductor site)
- Goalpara
Embankments under this programme are designed to a 100-year flood return period with climate-adjusted freeboard. Implementation runs through FREMAA, the state’s Flood and River Erosion Management Agency.
The World Bank programme. The Assam Integrated River Basin Management Program provides an initial $108 million tranche as the first phase of a $500 million multiphase approach, focused on strengthening ASDMA institutional capacity and disaster-financing instruments.
What industry should do with this:
- If your facility is located within or adjacent to an ADB intervention area, contact FREMAA directly and understand the timeline and design specification of planned embankment and drainage works nearby. Your own protective design should coordinate with public infrastructure, not duplicate it.
- For anchor investments in high-hazard districts, negotiate facility-specific protective infrastructure as part of the broader incentive package. Rs 14,044 crore in government support has already been committed at Jagiroad. Flood protection should be in the same negotiation.
- For lenders: treat district-level flood hazard classification as a standard due-diligence line item. For investments in very-high-hazard districts, require a site-specific H&H study and documented flood-proofing design basis as a disbursement condition.
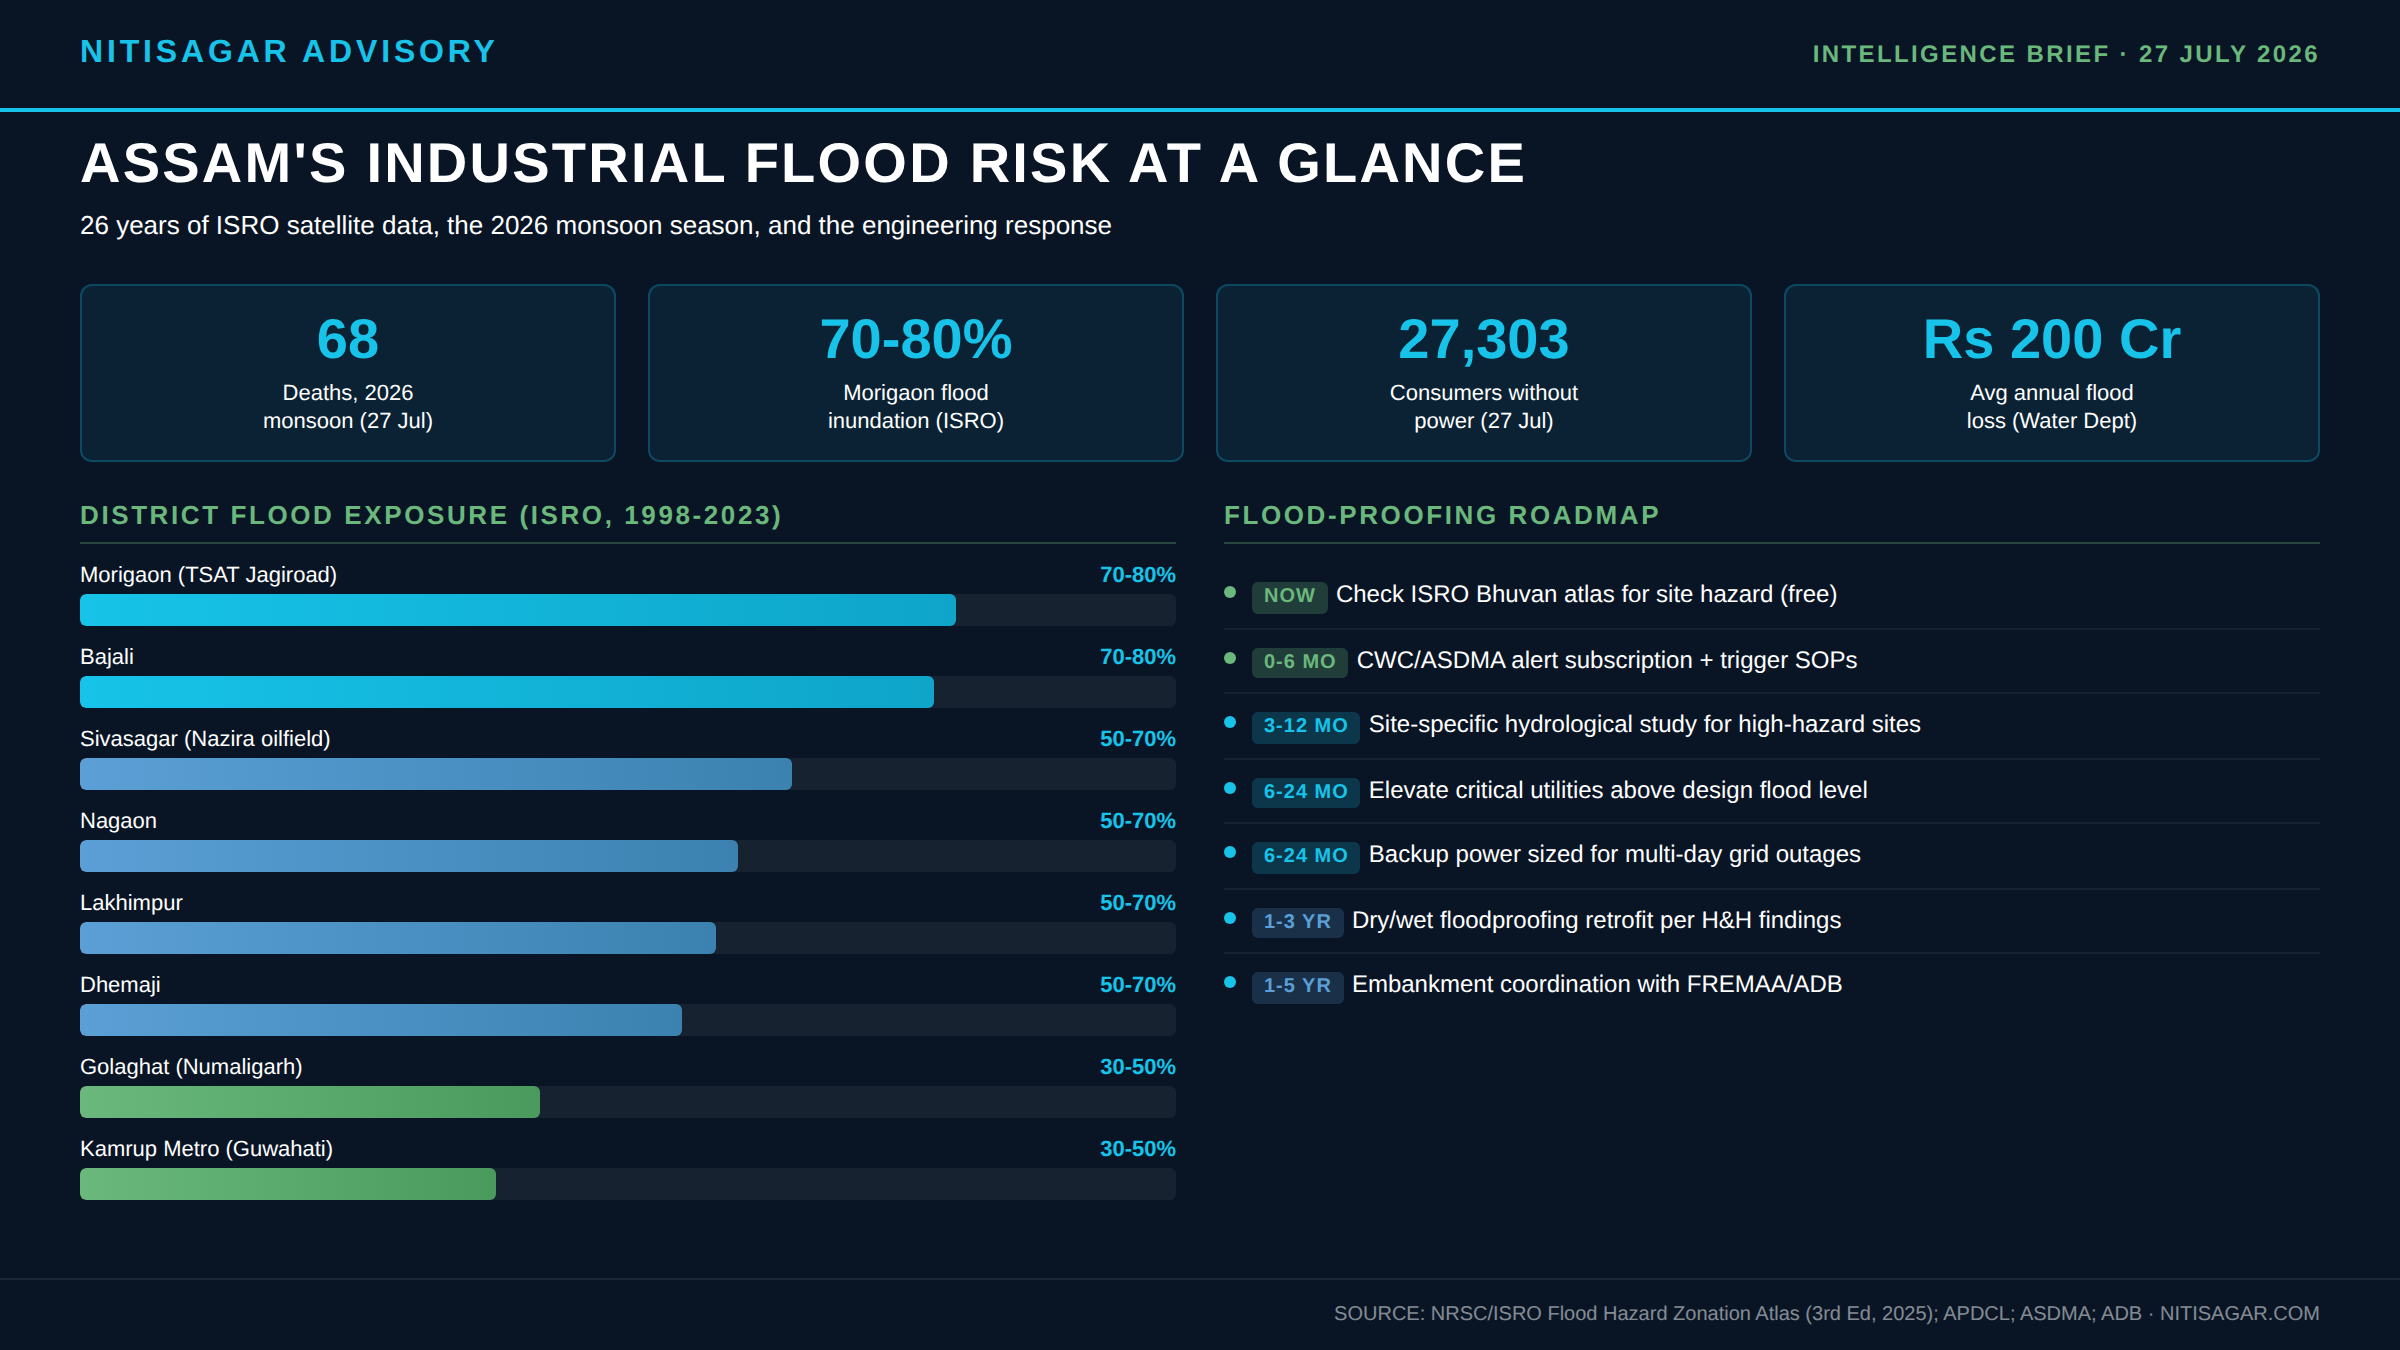
FIGURE 1: FLOOD-PROOFING ROADMAP FOR ASSAM’S INDUSTRIAL ASSETS
Phased implementation sequence. Sources: FEMA P-936; ASCE 24; NDMA flood management guidelines; ADB project documentation.
Priority 1 costs nothing and takes an hour. Open the Bhuvan geoportal, navigate to the flood hazard zonation layer, and check your site’s district and revenue-circle classification.
Priority 2 costs nothing and saves decisions during a crisis. Subscribe to CWC flood bulletins for your river reach. Write a one-page SOP that specifies which gauge reading triggers which action. Pin it to the factory wall. Test it once before June.
Priority 3 is where the capital decision begins. A site-specific hydrological and hydraulic study for a single facility costs a fraction of what one flood shutdown destroys in production value.
The Nazira oilfield shutdown was not a black swan. It was the predictable outcome of industrial infrastructure located in a flood plain without adequate protection. The satellite data identified the exposure years ago. The climate projections confirm it is growing. The ADB is already building embankments in Morigaon.
Assam’s industrial base was placed along the Brahmaputra and its tributaries for good reasons: transport, cooling, and resource access. Those reasons still hold. But the flood plain is not where it was 20 years ago, and the state’s most consequential industrial investment of the decade is located in the highest-hazard district.
The satellite data is free. The engineering standards exist. The ADB-financed embankments are under construction. The question is whether industrial planning catches up with the hydrology before the next monsoon, or after it.
For MSMEs evaluating any site in Assam, the Nitisagar Subsidy Calculator maps the capital investment incentives available under UNNATI 2024 and NEIDS across every district. Cross-reference those numbers against the ISRO flood hazard atlas. That ten-minute exercise is the starting point for everything in this briefing.
The moves that matter, before they cost you
Reports like this one are how we go deep on the shifts that decide which projects work in Northeast India. Every new report, briefing, and analysis in your inbox — original reporting, no syndicated fluff.
We'll map your project against IIPA 2019 and Assam's incentive stack, complimentary, no commitment.
Get a Free Pre-Assessment